
What is Data?
Data represents raw elements or unprocessed facts, including numbers and symbols to text and images. When collected and observed without interpretation, these elements remain just data—simple and unorganized. When these pieces are analyzed and contextualized, they transform into something more meaningful.
Data comes in various forms:
– Quantitative data, like an item’s weight, volume, or cost, is provided numerically.
– Qualitative data is descriptive but non-numerical, such as a person’s name and sex.
What is Information?
You get information when data is processed, organized, interpreted, and structured. The comprehensible output derived from raw data helps inform decisions, strategies, and actions. Information is essentially data made valuable and accessible—an integral component of decision-making.
For instance, if data points include daily temperature readings over a year, information is recognizing the trend of temperatures, understanding seasonal changes, and predicting future weather conditions.
What is the Difference Between Data and Information?
The journey from data to information involves several key distinctions:
– Data is raw and unstructured, like individual customer interactions or transaction logs.
– Information provides context and insights, like a trend analysis that shows increasing customer satisfaction or sales figures over time.
– Data is often abundant and readily available but can be overwhelming without interpretation.
– Information is curated and actionable, offering strategic insights to guide business decisions.
Examples of Data vs. Information
Data, represented as raw figures and observations, serves as the foundation. When processed and analyzed, this data becomes information—delivering actionable insights and strategic direction for businesses.
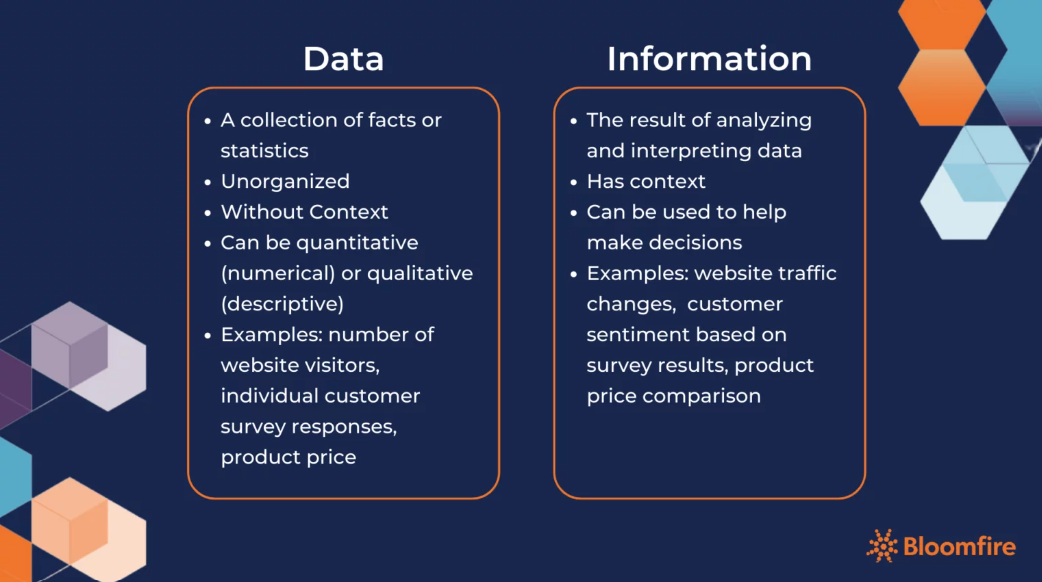
Examples of Data:
– The number of visitors to a website in one month
– Inventory levels in a warehouse on a specific date
– Individual satisfaction scores on a customer service survey
– The price of a competitors’ product
Examples of Information:
– Understanding that changes to a website have led to an increase or decrease in monthly site visitors
– Identifying supply chain issues based on trends in warehouse inventory levels over time
– Finding areas for improvement with customer service based on a collection of survey responses
– Determining if a competitor is charging more or less for a similar product
@KongVichka
https://t.me/iamkongvichka
Information: https://bloomfire.com/


